

Do you want to Debug Lightning components? - Let's talk about it.


One of the hot things of the moment in Salesforce ecosystem are the lightning components ⚡️, specially the lightning web components framework (LWC). They give us as developers a great and fluent experience to build modern UI components with ease that are easy to reuse and scale.
If you're new with javascript or maybe you find most of your time writing Apex code for the backend or even a consultant that has a little experience building code in the platform and for some reason of the universe you were told to solve a problem in a screen component in a Site or inside an app, I'm going to point you to some tools and tips to ease your work and hopefully get your job done faster!
Right console logging
The console API of your browser provides many functionalities that can help you debug your component. Sometimes we just use the log() method to print out values in the console. Here are a few more methods will improve your experience.
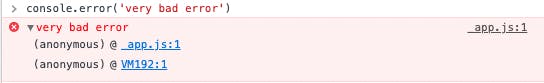
- console.error() : You can use these to especially print out errors ( I use mostly on catch blocks or callbacks). What is cool about it is that the message is printing in red, so is easier to identify in the console and you also get the stack trace.
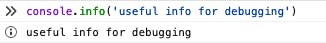
- console.info(): This one is just like log(), but the message is printed with an "i" in the side and you can filter by "info" in your console, making it easier to find your log.
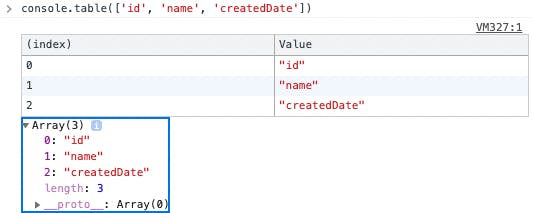
- console.table():This is a very useful one when we're trying to print out objets or arrays into the console, avoiding us to print the very useless '[object object]'. Instead you will get an output of index, value in form of a table.
The debugger is your friend
Browser and VScode debuggers are really powerful tools and are the ones I ended up using the most during these (sometime difficult 😥) times. These will give you a real time view of your code being executed step by step, if you want to just skip to some point of your code, breakpoints are your friends.
An easy way o add them is using the word 'debugger' in the line were you want the breakpoint, and we you open your inspector or launch VScode debugger and execute the code, the execution will stop at that line, letting you get a hint of whats going on with your component and see the live values while is executing.
Salesforce Lightning Inspector
is an extension that helps and enables you to:
- Navigate the component tree in your app, inspect components and their associated DOM elements.
- Identify performance bottlenecks by looking at a graph of component creation time.
- Debug server interactions faster by monitoring and modifying responses.
- Test the fault tolerance of your app by simulating error conditions or dropped action responses.
- Track the sequence of event firing and handling for one or more actions.
Basically is all you may need in order to debug or even build a component. Is integrated in your browser DevTools like this
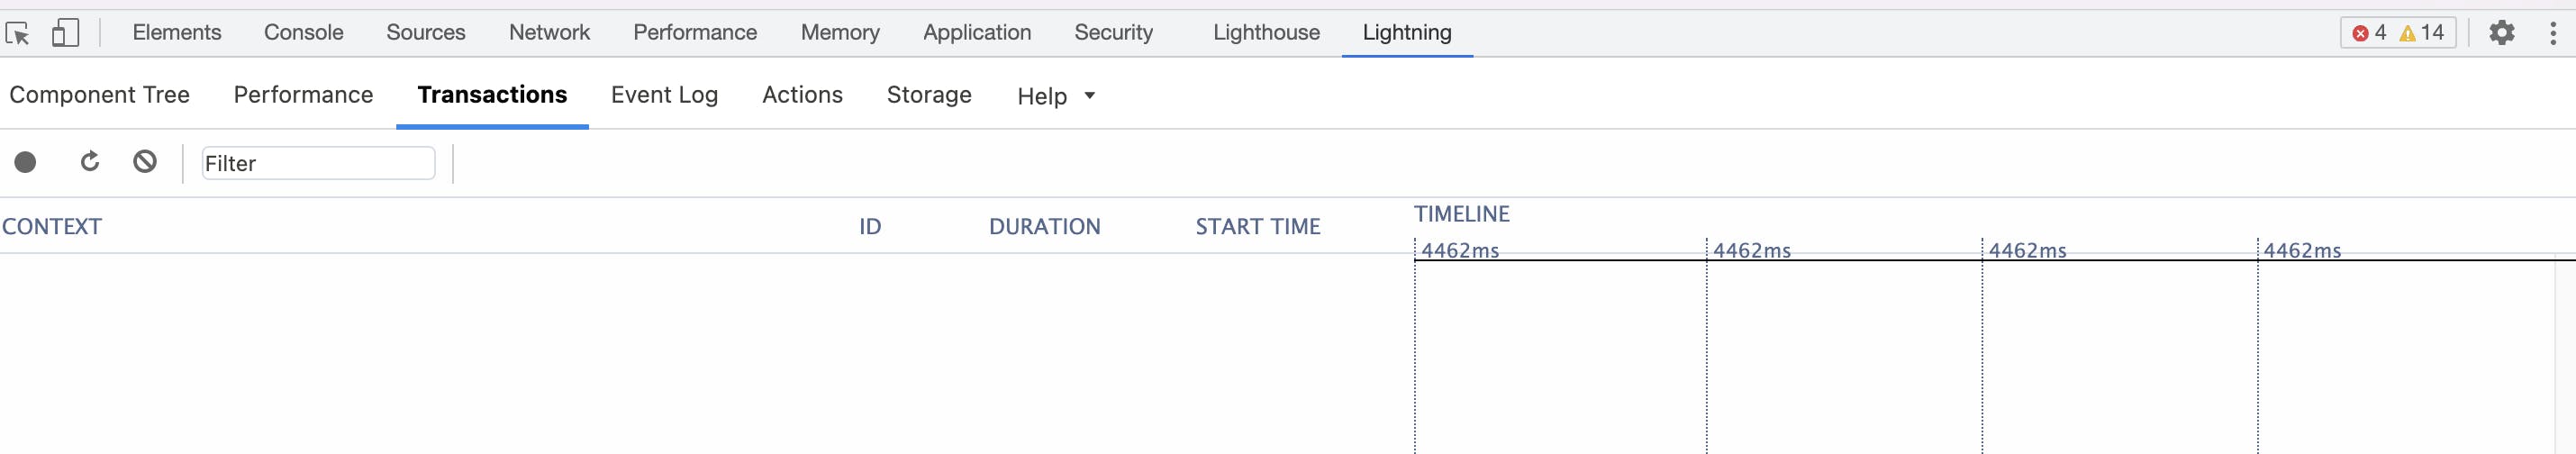
Depend on the case you might find yourselves using mostly the actions and transaction tabs. in resume, these tabs will allow you to see in real time how your component is being executed live, the stack trace and order of execution!
You can find more info about this extension here
In resume
We learn about how to add breakpoints to our code to watch the step by step, improve our loggings to the browser console and a new great tool that will help us monitor how our component interacts with Salesforce! 🥳